
Vegetation Change in Toronto’s Greenbelt:
A Remote Sensing Analysis
School Project | UBC | GEOS 373: Introductory Remote Sensing
Remote Sensing • GIS • Land Use Analysis • Urban & Environmental Systems
In collaboration with Jeffery Liao, Abigail McWilliams, and Stephen Zhao
11 April 2024
Introduction
This project investigates land-use change and potential environmental impacts within the Greater Toronto Area’s Greenbelt using satellite imagery and remote sensing analysis. The Greenbelt was established to protect environmentally sensitive lands, agricultural areas, and ecological corridors from urban expansion.
Recent policy debates surrounding proposed development within parts of the Greenbelt have raised concerns about habitat loss, agricultural land conversion, and long-term sustainability. This project uses satellite-based land cover analysis to examine patterns of land use and environmental change in and around the Greenbelt region.
By combining geospatial analysis with environmental policy context, the project demonstrates how remote sensing can support evidence-based discussions around land protection and urban development.
Research Question
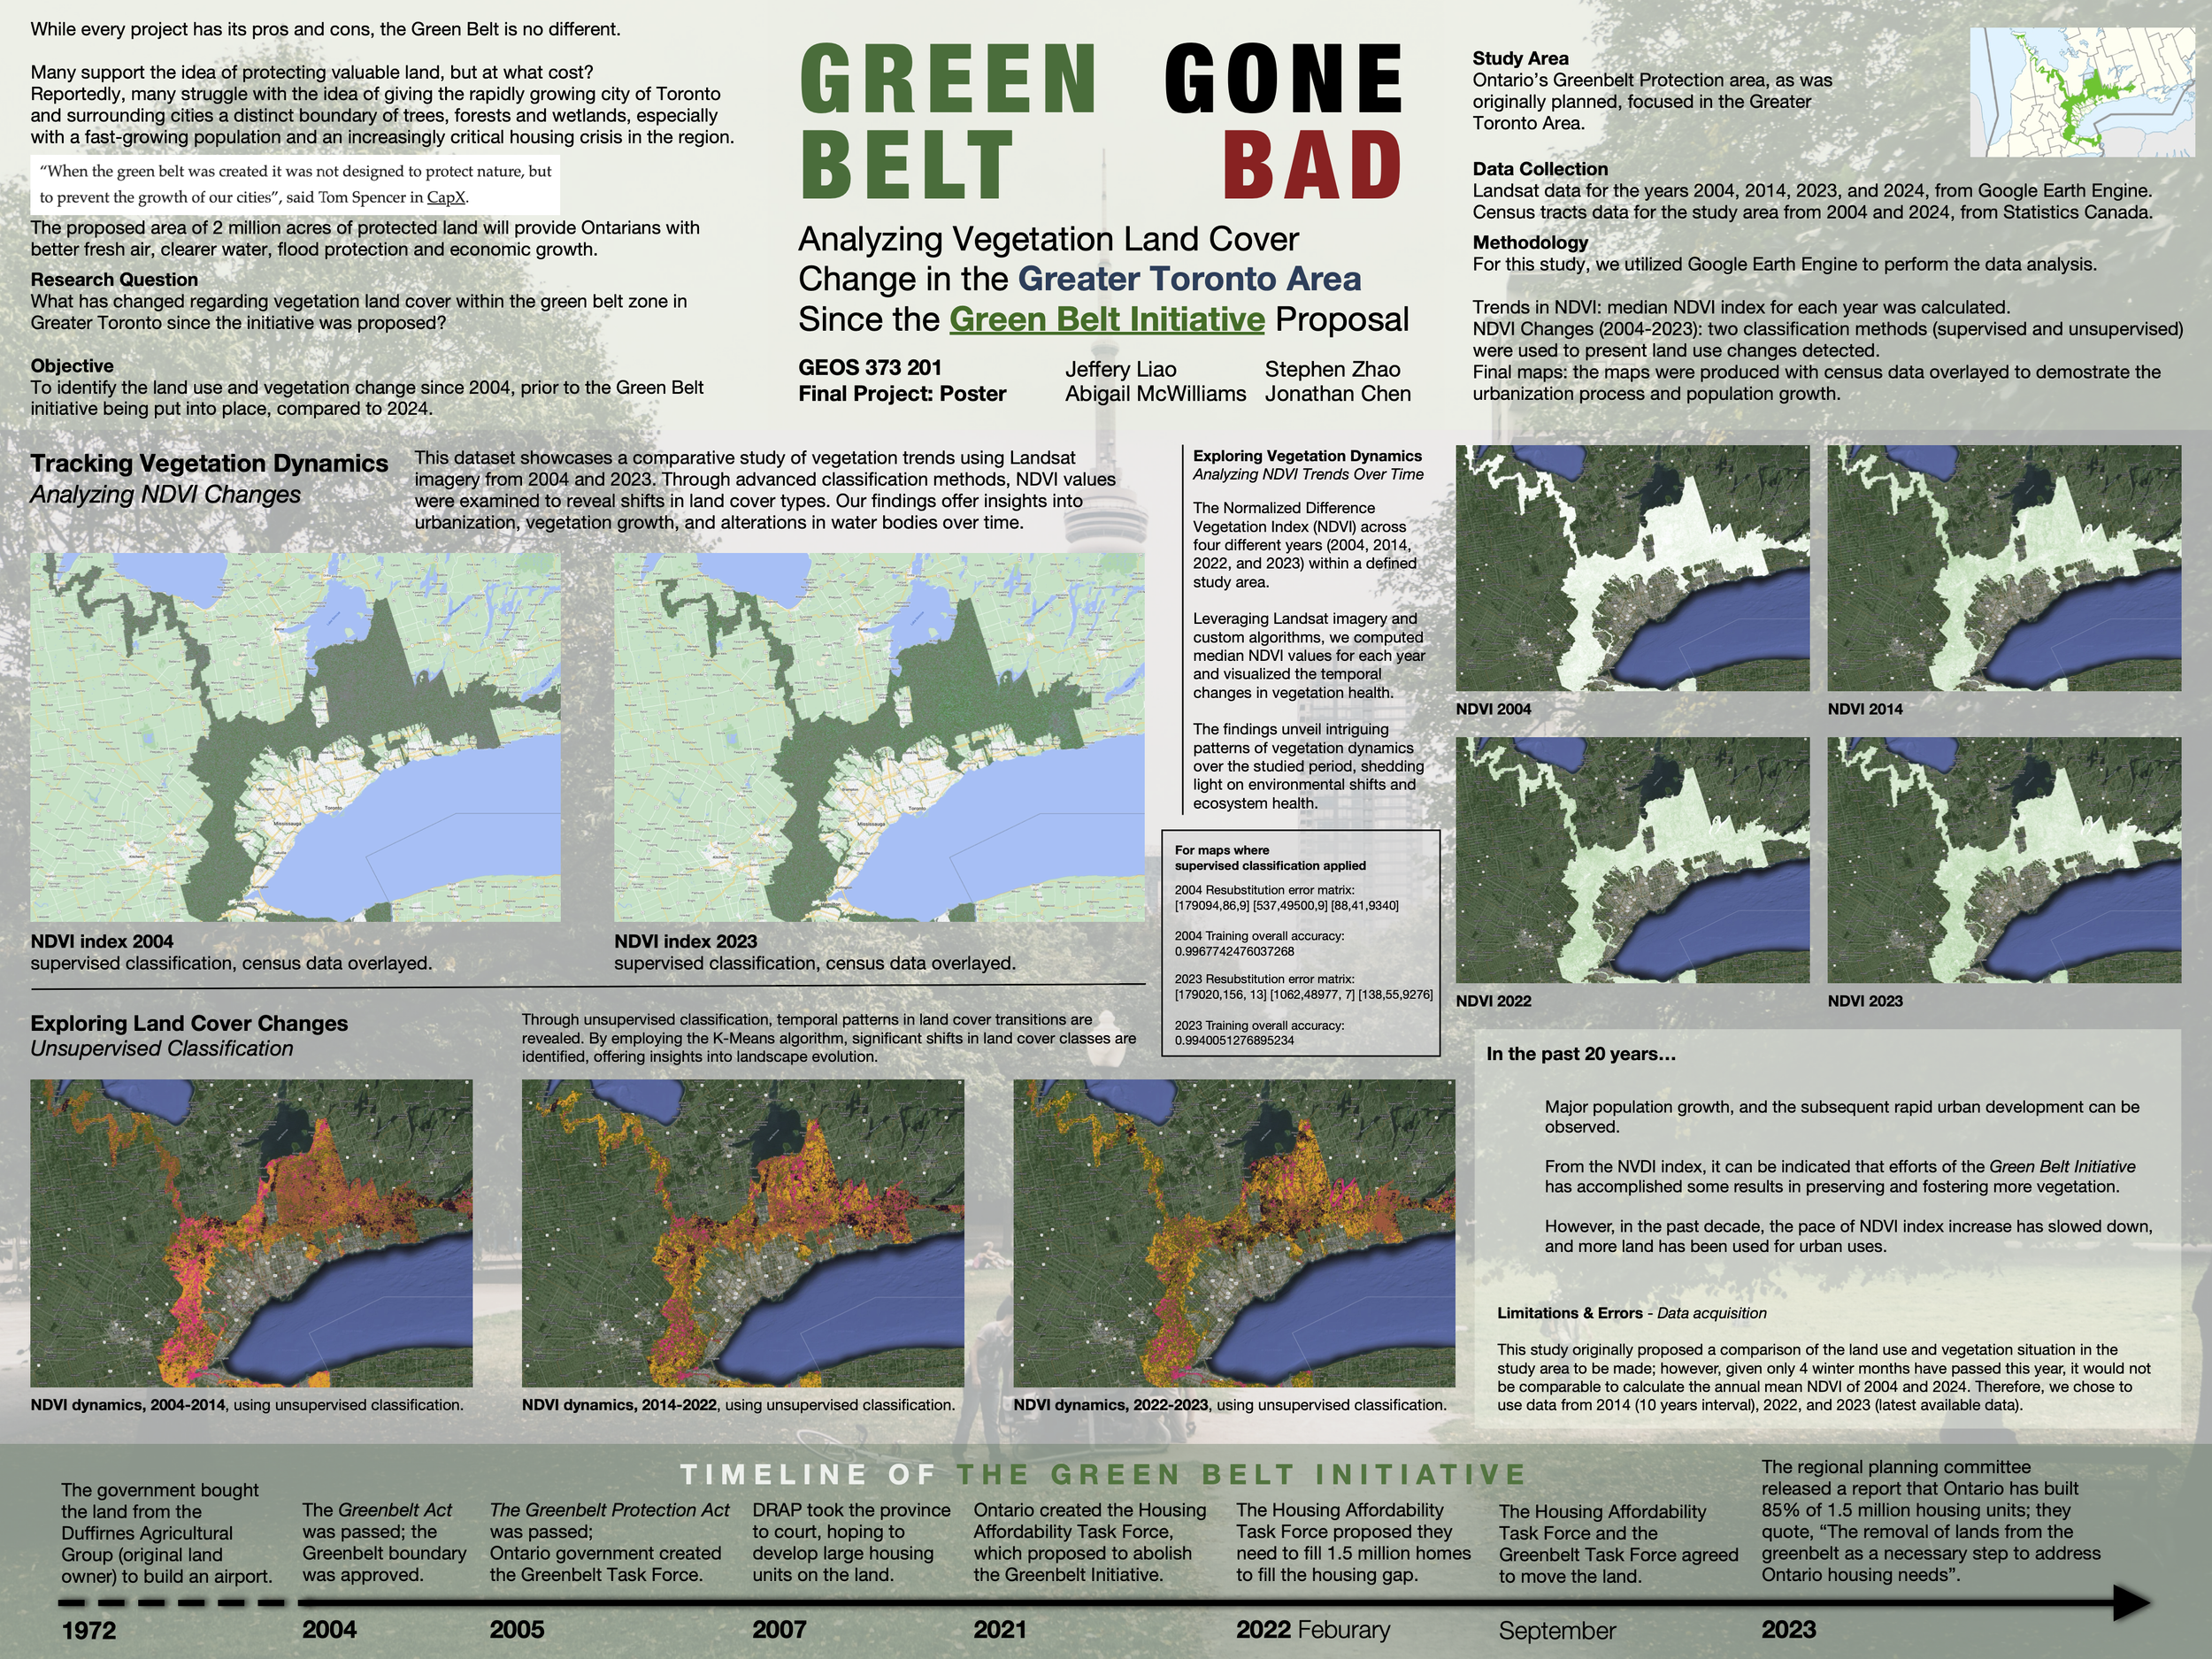
What has changed regarding vegetation land cover within the green belt zone in Greater Toronto since the initiative was proposed?
Objective
To identify the land use and vegetation change since 2004, prior to the Green Belt initiative being put into place, compared to 2024.
Study Area
Ontario’s Greenbelt Protection area, as was originally planned, focused in the Greater Toronto Area.
Methodology
This project applied remote sensing and GIS analysis to examine land cover patterns within the Greater Toronto Area’s Greenbelt.
Satellite imagery and land-cover datasets were analyzed to identify different land-use categories, including forested areas, agricultural land, urban development, and other landscape types. Spatial analysis was used to evaluate patterns of land cover within selected areas of the Greenbelt and to identify locations where development pressures may intersect with environmentally sensitive landscapes.
The analysis demonstrates how satellite data and geospatial tools can be used to monitor environmental change, support land-use planning decisions, and provide visual evidence for policy discussions related to conservation and urban growth.
For this study, we utilized Google Earth Engine to perform the data analysis.
Trends in NDVI: median NDVI index for each year was calculated.
NDVI Changes (2004-2023): two classification methods (supervised and unsupervised)
were used to present land use changes detected.
Final maps: the maps were produced with census data overlayed to demonstrate the urbanization process and population growth.
Data Collection
Landsat data for the years 2004, 2014, 2023, and 2024, from Google Earth Engine.
Census tracts data for the study area from 2004 and 2024, from Statistics Canada.
Key Findings
The analysis highlights the spatial relationship between rapidly expanding urban areas and protected Greenbelt lands. Several areas near the edges of the metropolitan region show increasing development pressure where agricultural or natural landscapes intersect with existing urban infrastructure.
The project illustrates how geospatial analysis can reveal patterns of land-use pressure that may not be immediately visible through conventional planning reports. Remote sensing provides an important tool for monitoring landscape change and evaluating the environmental implications of policy decisions affecting protected lands.
Presentation Poster
My Contributions
Conducted remote sensing analysis of land cover patterns within the Greater Toronto Area, integrating satellite imagery and geospatial datasets to identify landscape categories and development pressures
Performed spatial analysis and visualization using GIS tools
Interpreted geospatial findings in relation to environmental policy debates surrounding the Ontario Greenbelt
Developed visual outputs and analysis to communicate land-use change and environmental implications